Social network analysis (SNA) documents relationships between people, technology and groups, as well as providing a framework to evaluate these relationships. In this case, groups can mean organizations like different clinical groups treating the same chronically Ill patient. On some levels SNA looks at social structures between groups and individuals to analyze the connections and flow of information. There is a fair amount of research using SNA to analyze the healthcare industry. Unfortunately, most of it appears focused on clinical personnel.
This is an important point when you examine the role of population health management platforms in treating chronic illness. These platforms communicate patient information to clinical personnel, operational information to health systems and treatment information to patients. Clinical elements are emphasized because care coordination is driven by the free flow of patient information between healthcare providers to collectively treat chronically ill patients at a lower cost and with better outcomes.
What about the patient? Where do they fit in? In a previous post I wrote about treating patient communication as an equal to the clinical and operational elements of population health platforms. I believe we can improve health literacy in chronically ill populations by using SNA theory to identify barriers in patient communication.
In support of this discussion, I want to introduce some of the core concepts of SNA without going into detail. I’ll explore them in greater depth in future posts to discuss how they might be used to analyze patient data and communications flow in chronically ill populations.
So many terms!
I’ll start with an overview of terms and briefly review how they tie into healthcare networks treating chronic illness. Again, in future posts I will dig into the details a bit more to highlight how they may affect healthcare.
Size: This is the number of people in a particular network. For a patient with chronic illness, this means all the clinical (and other personnel) with whom they interact for their care.
Connections: Most of the following terms describe the relationships and connections between individuals: Homophily, Multiplexity, Mutuality/Reciprocity, Network Closure and Propinquity. Think of the clinical personnel and the patient.
Distributions: These are terms like Bridge, Centrality, Density, Distance, Structural Holes and Tie Strength. How all the individuals are connected to each other, the strength of the connections and how networks are connected to one another. Think of different clinical groups or departments within a health system and payer and how they connect to the patient.
Segmentation: Terms like clustering coefficient and cohesion. Think of the strength and number of connections within a particular group. Are they directly or indirectly connected? An example would be a group of primary care physicians who all see the same patients.
Because there is so much information here, I’ll examine the details in future posts. The important focus is the huge range of strong and weak network connections that have an impact on patient care, especially in chronically ill populations who deal with a far wider range of medical personnel.
Can we visualize the results?
Visualization of social networks provides a way to show the results of your social network analysis. The following graphic shows how some networks might be displayed.
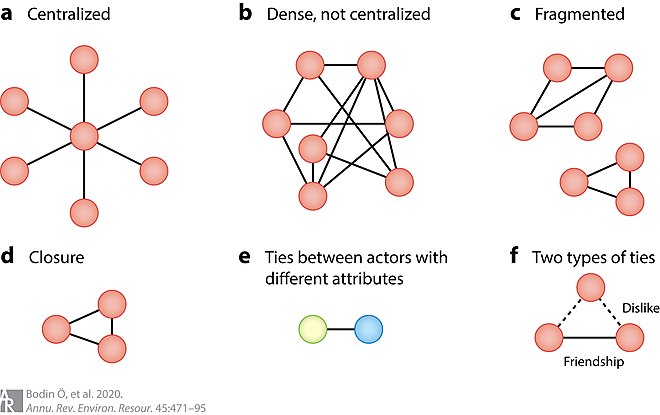
These diagrams can represent a practice of doctors, different groups of clinical providers, even disparate healthcare actors like payers and healthcare system personnel who interact with a chronically ill patient.
I shared the following graphic in a previous post as a way to highlight the different groups who might communicate with a patient. The purpose of the graph was to document the range of communication touch points that occur in healthcare encounters.
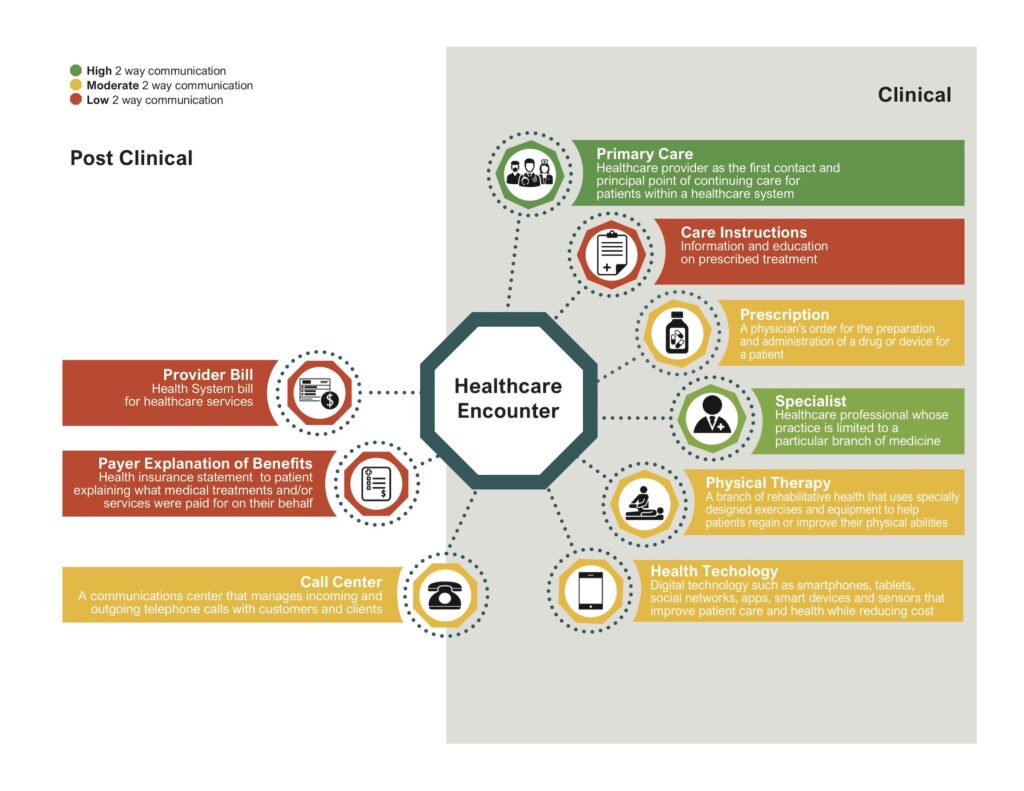
This diagram mimics example A in the figure above, the centralized network – in which the patient is the center of the graph. All the peripheral players represent healthcare actors who might interact with the patient. If we want to layer on the idea of a longitudinal health record, then we would add connections between all the healthcare providers sharing information about a particular patient. This creates network density as shown in figure B. Why is this important? Because network density can help improve the flow of information throughout the network which is a key element of coordinated care.
Where do we go?
Social network analysis shows us, when you truly dig down to understand the underlying interactions in healthcare, you will find relationship complexities playing a role in the outcome. It’s easy to say we can make all patient data available as part of a longitudinal health record. And we can encourage the clinical personnel to cooperate with each other in the treatment of chronically ill populations. But this doesn’t account for the fact relationships between individuals and groups affect the outcome.
Can we use social network analysis to examine the actual patient communication activity taking place in support of chronically ill populations? I believe we can. At a minimum, it’s worth exploring.
We may find there are barriers to which we have no answers at this point. What we may also find is there are opportunities for creating patient communications that minimize some of the disconnects or relationship issues uncovered by social network analysis.
More to follow.
No Comments